Current Infrastructure Information
Thruway Roads
There are 570 centerline miles of pavement on the Thruway. The original Thruway pavement on the system was constructed using a 9-inch thick concrete pavement. Over time, the concrete was overlaid with asphalt.
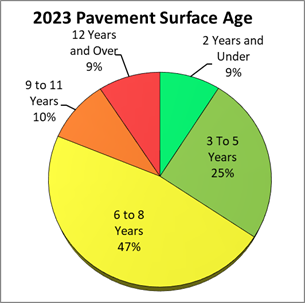
Figure 1 provides an overview of the age distribution of Thruway pavement surfaces. The average six-year old surface is supported by the original 65-plus year old concrete slabs and subgrade materials. The condition of the pavement below the surface is a major concern when deciding how best to repair, rehabilitate or reconstruct roads, as surface treating the asphalt on top of the concrete does not address underlying concerns including drainage, poor soils and broken concrete slabs. The condition of the original concrete slabs and the material underneath these slabs may, or may not, be in good condition.
Figure 1. Pavement surface age of the New York State Thruway network as of Spring 2023
Inspecting Roads
Each roadway section is inspected annually using specialized equipment to measure ride quality and its surface condition is evaluated from photographs of the pavement surface. Based on these inspections and measurements, condition ratings are developed to represent each roadway section.
Ride Quality
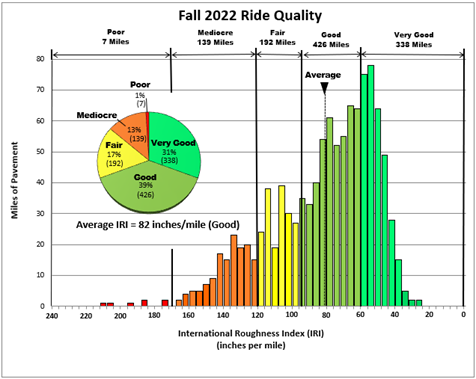
Ride quality is measured using special laser sensors mounted on a vehicle traveling at highway speed. Each year, an Automated Road Analyzer (ARAN) vehicle is used to collect ride quality measurements. The ride quality measurement, recorded in inches per mile, indicates how smooth or rough the road rides and is expressed using the International Roughness Index (IRI). The federal government has established standards to describe ride quality using the IRI. Based on IRI standards for U.S. Interstate-style roadways, 70 percent of the Thruway is rated Good or Very Good (Figure 2).
Figure 2. International Roughness Index for the New York State Thruway network measured in Fall 2022
Lane Distress Index (LDI)
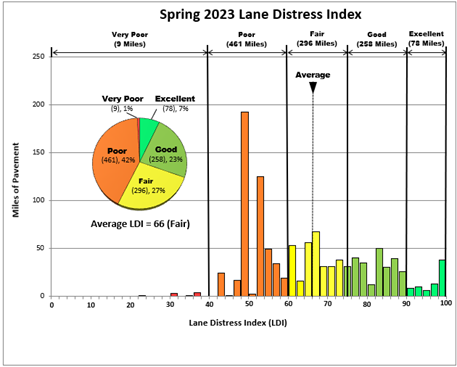
The Lane Distress Index (LDI) characterizes the extent of pavement surface damage over the travel lanes. The index helps prioritize where to pave and how to invest. It also helps to forecast future paving needs and locations. Each year, the Thruway has photos taken at highway speed every 20 feet in both directions. The various surface distresses are assessed by trained (certified) raters for each mile of roadway and converted to the LDI (Figure 3). The more extensive the surface distresses, the lower the LDI. The LDI for each mile is then averaged over specific Thruway planning segments, which vary in length from 1 to 15 miles long. Figure 4 shows the average Thruway pavement surface condition based on this measurement is characterized as Fair (66), with 30 percent of the road rated Good or Excellent.
Figure 3. Typical image of the pavement surface from a highway segment with a Lane Distress Index rated “Fair” due to the presence of significant cracking across the highway, between the lanes, and along the right edge of the travel lane.
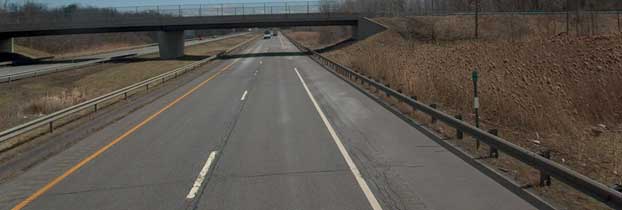
Figure 4. Lane Distress Index for the entire New York State Thruway network measured in Spring 2023
Pavement Asset Management
Pavement Asset Management focuses on prioritizing and deciding on the most cost effective and appropriate treatments for roadway segments necessary to keep condition levels within acceptable ranges. Roads rated Poor may show signs of surface deterioration including cracking, potholes or patches, or have poor ride quality. Additionally, for each section of the road, a maintenance and Capital Project history has been developed. Also accounted for are high traffic volume (congested) corridors, heavy truck loadings, and project coordination requirements. These factors are all considered in project selection and prioritization methods.
Some sections of the road in Poor condition can be resurfaced using a 'mill and inlay' type of treatment. This treatment type restores the surface condition and ride quality by eliminating cracking, potholes and patches, providing many years of service at a relatively low cost. Mill and inlay treatments, however, may not be effective in other locations due to the underlying deteriorated 65-plusyear old roadway base and/or poor drainage. In such circumstances, deeper treatments, up to and including removal of the original concrete slabs followed by a complete reconstruction, may be necessary.
Bridge Asset Management System
The Bridge Asset Management System is designed to reflect the unique characteristics of the Thruway system of bridges; it contains objective, coherent and integrated decision-making processes which are data driven and replicable. Comparable data for each of the 817 Thruway bridges is analyzed in detail by a multi-disciplinary team to determine the type of work needed to keep the structures safe and in serviceable condition. By incorporating 30 years of inspection data, inventory data, structural details and vulnerabilities, highway safety data and capital and maintenance history with operational concerns for each bridge, this information can be used to develop and prioritize Capital Projects, as well as establish long-range plans for each structure. The goal of the Bridge Asset Management System is to establish long term programmatic planning by maximizing the remaining safe service life of the Thruway bridge population, while addressing non-condition related vulnerabilities. Each bridge receives a thorough diagnosis of its history, structural condition, design details and operational needs.
Thruway Bridges
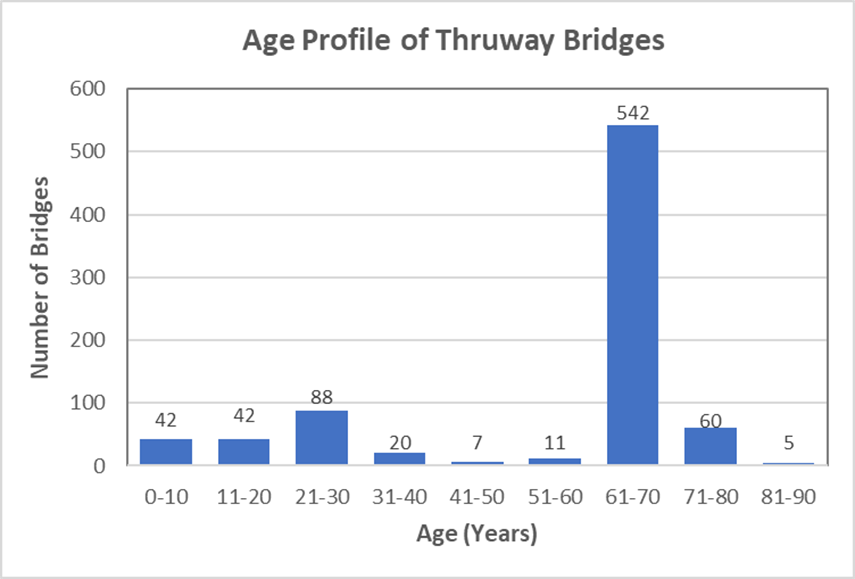
The Thruway Authority owns and maintains 817 bridges. Bridge reliability is critical to public safety and the continuity of the Thruway System. Figure 5 shows that as of 2023, there are more than 600 bridges (74 percent) more than 60 years old, including several major bridges. The average bridge is 57 years old. Many of these bridges, while they are safe for travel, need rehabilitation work or costly replacement.
Figure 5. Age of Thruway bridges in Spring 2023
Inspecting Bridges
In accordance with New York State and Federal law, a NY State licensed Professional Engineer inspects each Thruway bridge at least once every two years, at a minimum. Each inspection is documented with a written report, which provides a detailed description of the condition of the bridge and identifies any safety concerns. In New York, bridge inspectors assess all bridge components. They are required to evaluate, assign a condition score and associated quantities, and document the condition of structural elements on a span by span basis, in addition to general components common to all bridges. Bridge condition information is used to establish preventative and corrective maintenance programs, as well as bridge rehabilitation and replacement decisions. Decisions on specific bridge improvements are made after detailed evaluations of inspection reports and other information, such as traffic volumes and loads.
Bridge Conditions
In addition to a quantitative evaluation of each individual element of the bridge, the lead inspector assigns a General Recommendation. This rating is the inspector’s assessment of the overall bridge condition. Maximum weight is given to the bridge elements of most importance. The 1 to 7 scale is summarized in Figure 6. The General Recommendations for the Thruway’s bridges are summarized in Figure 7.
Figure 6. Summary of General Recommendation ratings
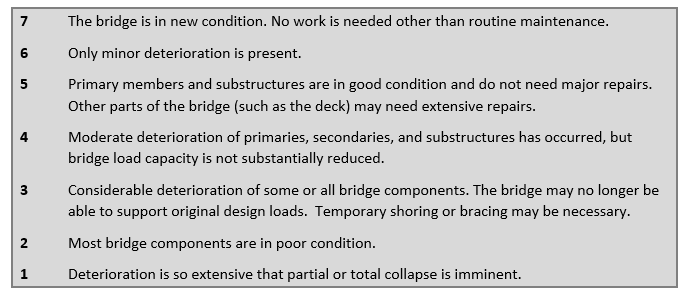
Figure 7. General Recommendations for the Thruway’s bridges at the end of 2022
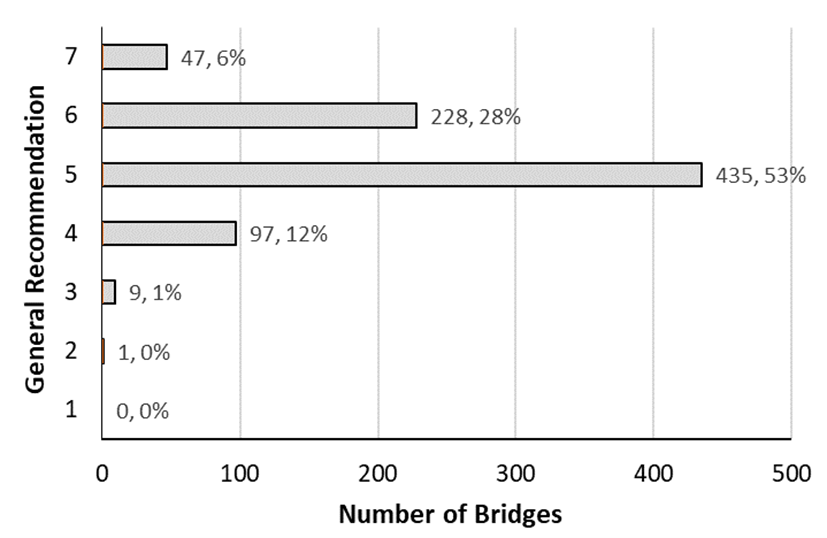
Figure 8 shows the historical and long-term trend for the average Thruway bridge General Recommendation for all Thruway bridges inspected thru the end of 2021.
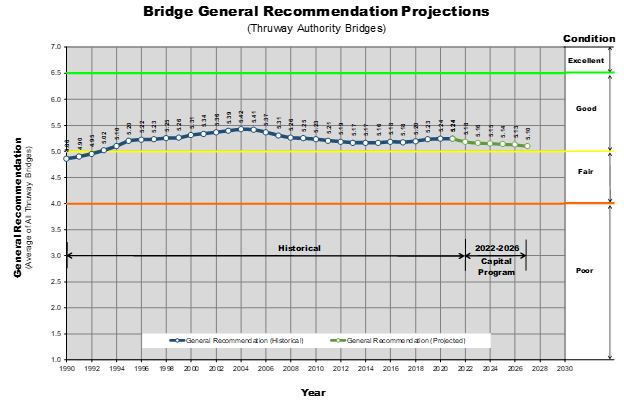
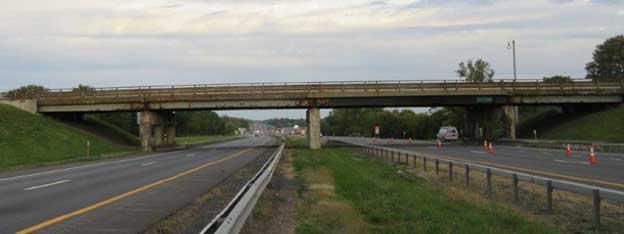
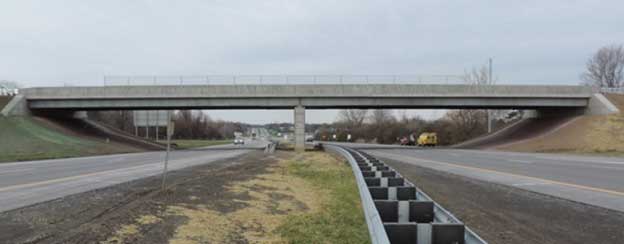
Figure 9. Overhead bridge at exit 37 near Syracuse at MP 283.79. (Top picture) is the original structure (built in 1954) shown in 2019, when it was rated during inspection with a General Recommendation of 3. (Bottom picture) is the replacement structure built in 2020, rated during inspection with a General Recommendation of 7.
Our System
Capital Program
Projects Map